Firstly, I want to say that I think metrics are awesome. So while this post is looking at what metrics can’t do, there is an awful lot they can do. Being aware of the pitfalls of metrics can make them even more useful.
Example metrics
There are lots of metrics that you can use to support your development practices. Here I’m going to describe a handful of the metrics that I’ve found useful in the past, but also how they are imperfect and can’t be relied upon to paint the whole picture.
Test coverage percentage
A really common metric to use is test coverage percentage. It’s the percentage of lines of code that are covered by tests.
A lot of testing tools and frameworks make this a really easy metric to collect. For example, if you are using Jest, then you just need to add the –coverage flag to get an output like this.
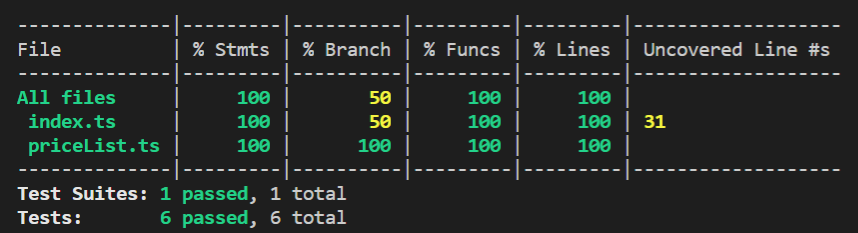
Tests are super important, so low coverage is a sign that you need to get more tests in place. However, coverage only shows what is covered by tests. It doesn’t show if the tests are actually useful.
Lead time
Lead time is a metric that I love to use. It shows the time it takes for a ticket to hit the backlog and then make it’s way to production. If your lead time is getting larger it may be an indication that work is flowing freely and quickly through your development life cycle.
A small lead time is great as new ideas can be realised quickly in order to create value. However, a small lead time doesn’t necessarily mean that you are adding value.
Velocity
You can calculate your velocity by measuring how much work you can deliver within a period of time. You can measure it in number of tickets, story points, or whatever makes sense for your workflow.
It’s great to be able to deliver a lot. So tracking velocity can be really useful. A low velocity may be a sign of a bottleneck in your processes. But a high velocity can give a false positive impression if tickets are sliced too small or your way of measuring velocity is inflated.
What metrics can’t do
As we’ve seen a metric can be cheated, purposefully or not. You can’t take a metric on it’s own and have a full understanding of the why. They are only an indicator.
What metrics can do
While a metric having a good score doesn’t tell you very much, they are still super useful and important.
When one of your metrics doesn’t have a good score, it’s not going to tell you exactly what is wrong, but importantly it will tell you that something is wrong. Just like a code smell, it’s an indication that there is a problem, but you’ll still need to find it.
How to pick and use your metrics
Since metrics are there to give you the bad news, you should be picking metrics to highlight issues that you want to avoid. For example, you don’t measure test coverage because you want to see how high it is, you measure test coverage to act as an alert if you are missing tests.