Code coverage reports are super useful to help make sure your code is well covered by tests. However it can be difficult to make sure all of your lines and functions are covered when only looking at top level percentages. Tools such as NCrunch and Wallaby feature awesome line by line live code coverage. These are fantastic tools and worth the money, however if you’re working on personal projects you might not have the budget to use them. So here is a free way to get line by line code coverage for your Node or Typescript projects in Visual Studio Code.
Feedback loops with code coverage gutters
Feedback loops in programming are crucial. It’s great to have various feedback loops at different levels. Unit test coverage reports are awesome, but the feedback loop they provide is a step above the code. They are typically used within CI pipelines in order to ensure code coverage stays high from commit to commit. Even if you review the report as part of your development process, there is a disconnect between reading a report separately from the code you are writing.
By using one of the paid tools or the free Coverage Gutters plugin in Visual Studio Code you can make the test coverage feedback loop a little smaller by seeing it on a line by line basis. This will hopefully highlight gaps in your test coverage more quickly, hopefully making the gaps in coverage easier to close.
If you are developing using TDD (which I hope you are), this is excellent quick feedback to make sure you aren’t adding code that isn’t covered by the test you are trying to make pass and go green.
The plugin
The plugin I’ve found to get line by line code coverage is Coverage gutters. For Node projects it’s really easy to setup.
You’re going to need a lcov.info file for the plugin to pick up. With Jest, all you need to do is add the –coverage flag to your jest command.
jest --coverage
Once you’ve got a lcov.info file you’ll need to enable the plugin. You can do this for just your current file, but using the plugin with “Watch” will be much more useful as it picks up changes in your coverage file and applies it to all files.
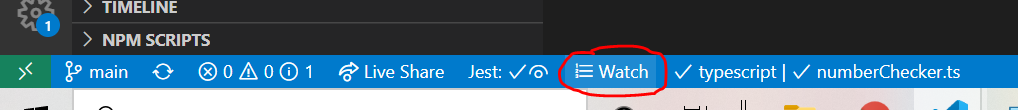
You can activate the plugin via the “Watch” button on the status bar;
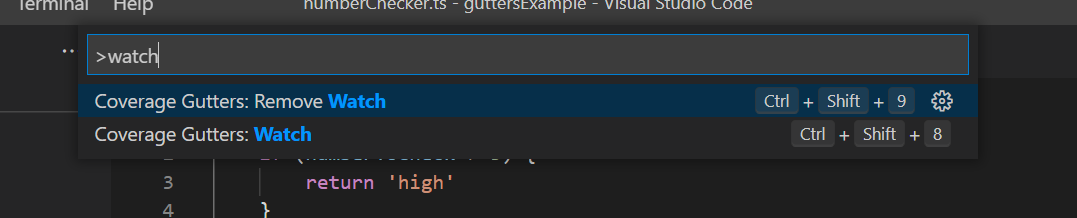
Or by selecting “Watch” in the command palette.
Then if you add the watch flag to your Jest command, your coverage report will continuously update which will be picked up by Coverage Gutters to give you that instant feedback.
jest --coverage --watch
Example repository
For a basic example of a repo ready to use the Coverage Gutters extension, you can use this repo I have set up.
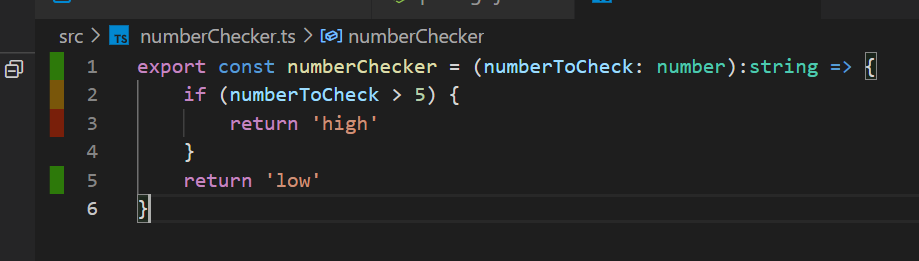
You can see the green lines that are covered by tests, the amber lines where the code path has not been taken, and the red lines that the tests are not covering at all.
Give it a go and keep those feedback loops small!